Cardiac Electrophysiology is defined as the study of diagnosing, and treating the electrical activities of the heart. Doctors use electrophysiology tests to understand the nature of abnormal heart.
Cardiac tissue has distinctive electrical characteristics. Intercalated disks allow action potentials to pass to adjacent cells. Myocardial cells can spontaneously depolarize, a process called automaticity. This spontaneous depolarization generates a pacemaker potential or prepotential and is caused by decreasing K+ and increasing Ca++ and Na+ permeability. This occurs at the fastest rate in sinoatrial (SA) node, so the SA node acts as the normal pacemaker for the heart. If cells other than SA node dominate rhythm, the pacemaker is called “ectopic.”

The fibrous tissue that seats the cardiac valves provides a border between the atria and the ventricles. This tissue lacks gap junctions and consequently electrically isolates the atria from the ventricles, this electrical insulation allows the atria and ventricles each to function as an independent syncitium.
Ionic movements, or conductances across the myocardial membrane, occur in response to the electrochemical potential gradient and are controlled by selective ion permeability. For ventricular myocytes, the Nernst equilibrium value for Na+ is +61 mV, for Ca++ is +132 mV, and for K+ is -95 mV. Increasing the permeability of any ion will drive the membrane potential toward the Nernst equilibrium value for that ion, and conversely, decreasing the permeability of any ion will drive the membrane potential away from the Nernst equilibrium value for that ion.
Multiple types of Na+ channels are found on myocardial cells. Voltage-gated Na+ channels are blocked by local anesthetics such as lidocaine and by tetrodotoxin. L-type Na+ channels also allow passage of Ca++ and can be blocked by verapamil. The presence of voltage-gated Na+ channels results in a “fast” type of myocardial action potential, characterized by a rapid rate of transmission. This type of action potential is characteristic of ventricular muscle and ventricular conductive tissue. The absence of voltage-gated Na+ channels results in a “slow” type of myocardial action potential, characterized by a slower rate of transmission. This type of action potential is characteristic of SA node and atrioventricular (AV) node tissue.
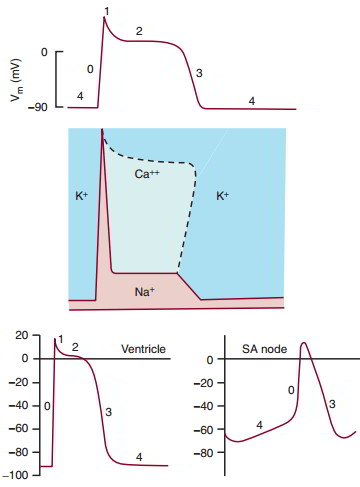
Ion permeability is altered to produce the five phases of the ventricular muscle action potential Phase 0 is rapid depolarization, caused by an increase in Na+ permeability through the voltage-gated fast Na+ channels. Phase 1 is a small recovery toward resting membrane potential, caused by an increase in Ca++ permeability while Na+ permeability decreases. Phase 2 is a plateau, characterized by continuing Ca++ permeability. Phase 3 is repolarization, caused by an increase in K+ permeability and a decrease in Ca++ permeability. During this phase, Ca++ is resequestered into the sarcoplasmic reticulum. Phase 4 is the resting membrane potential, characterized by high K+ permeability.
Slow (SA nodal) action potential phases are not so sharply defined. Nodal cells have a less negative resting membrane potential that spontaneously depolarizes. This phase 4 depolarization is due to decreasing K+ permeability or increasing slow Ca++/Na+ permeability, or both. The voltage-gated Na+ channels, if present, are inoperative because the h-gate is closed.
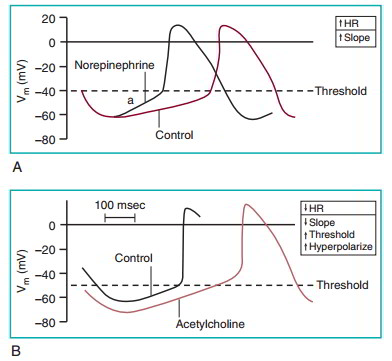
Pacemaker activity is stimulated by sympathetic nerves and inhibited by parasympathetic nerves. The autonomic neurotransmitters act through altering membrane conductance. The sympathetic neurotransmitter norepinephrine (A Above) acts through p1-adrenergic receptors to increase Na+ permeability and increase the heart rate. Acetylcholine (B Above) acts on muscarinic receptors to increase K+ permeability, which hyperpolarizes the cell, decreases the slope of phase 4 depolarization, and consequently slows the heart rate. Parasympathetic nervous system activation also changes the threshold to a less negative value. This decreases the slope of the phase 4 depolarization and consequently decreases the heart rate.
Why EP Study?
– Diagnose the source of arrhythmia symptoms
– Assess the efficiency of certain medications used to control HRD
– Forecast the risk of a future cardiac event (a sudden cardiac arrest)
– Check for the need for artificial pacemakers or other treatments (like RF Ablation)
Coordination of Cardiac Electrical Activity
The sequence in which the wave of depolarization spreads across the myocardium increases pumping efficiency of the heart. The SA node, at the junction of the vena cava and right atrium, normally initiates depolarization. The impulse spreads cell by cell through the intercalated disks through the atria. The contraction of the atria propels blood in the atria toward the AV valves.
AV nodal tissue has a slow conduction velocity and delays the passage of depolarization into the ventricles, allowing atrial contraction to complete before the onset of ventricular contraction. Once the wave of depolarization exits the AV node, it spreads through the common bundle of His on the surface of the right interventricular septum, through bundle branches, and into each ventricle. Finally, Purkinje fibers carry impulses from the endocardial surface into the ventricular wall, and the basal epicardial surface of the left ventricle is normally the last region of the heart to depolarize.
Electrocardiography
The electrocardiogram (ECG), an electrical potential recorded on the body surface, is a consequence of the flow of current from an area of depolarized myocardial tissue to polarized myocardium. The ECG provides a one-dimensional view of the current flow during the cardiac cycle recorded against time. Electrode placement markedly affects the measurement. Placement for humans was standardized by Einthoven.
In this system, the right leg is used as the electrical ground. Three bipolar limb leads (I, II, and III) and three augmented unipolar limb leads (aVR, aVL, and aVF) view current movement in the frontal plane of the body. Augmented unipolar limb leads are 50% larger than bipolar leads. Chest leads (V1 through V6) provide information in the transverse plane of the body, based on six anatomically determined positions of exploring electrode (V) on the chest (Table 7-1). Deviation from -30 to +90 degrees, the normal range of the ventricular mean electrical axis, provides useful diagnostic information. aVR, aVL, aVF, three augmented unipolar limb leads; LA, left atrium; LV, left ventricle; RV, right ventricle.
| Locations for Electrocardiogram Leads | ||||
|---|---|---|---|---|
| Lead | Positive Electrode | Negative Electrode | ||
| I | Left arm | Right arm | ||
| II | Left leg | Right arm | ||
| III | Left leg | Left arm | ||
| aVR | Right arm | (Left arm + left leg) | ||
| aVL | Left arm | (Right arm + left leg) | ||
| aVF | Left leg | (Right arm + left arm) | ||
| Vl-6 | Six positions on chest. | (Right arm + left arm + left leg) |
The ECG is a record of the current flow caused by electrical activity in the heart. Cardiac depolarization originates in the SA node and then spreads through the cardiac chambers. The numbers on the heart illustrate in milliseconds the interval between the origin of the depolarization at the SA node and the appearance of the depolarization in the different regions of the heart. The tracings on the right show the temporal relationship between the myocardial action potentials and the ECG. The P wave represents atrial depolarization, the QRS complex represents ventricular depolarization, and the T wave represents ventricular repolarization.
| Electrocardiogram Events | ||||
|---|---|---|---|---|
| Elapsed | ||||
| Time | Record | Cardiac Event | Duration | |
| 0.00 sec | P wave | Atrial depolarization | 0.06 sec | |
| P-R interval | Delay of impulse at AV node | 0.18 sec | ||
| 0.18 sec | QRS complex | 0.08 sec | ||
| ventricular | ||||
| depolarization | ||||
| Q-T interval | Ventricular systole | 40 sec | ||
| 0.40 sec | T wave | Ventricular | 0.15 sec | |
| repolarization |
The mean electrical axis is a single vector representing the sum of current flow during ventricular depolarization. It is constructed from any two ECG leads by addition of vectors (dropping perpendicular lines). The mean electrical axis can be used to predict the magnitude of the QRS complex in any lead.
In the analysis of the ECG, the six limb leads can be drawn originating from a common center point. Lead I provides a horizontal axis, and lead aVF provides a vertical axis. Deviation from the normal range of the ventricular mean electrical axis provides useful diagnostic information.
Devices
Implantation of cardiac devices is another part of electrophysiology. Pacemakers, Defibrillators (ICDs) and Cardiac Resynchronization Therapy (CRT=BiVentricular) are placed under the skin in the upper chest and are connected to wires that are snaked through veins and positioned into the heart for sensing, pacing and shock delivery.
It’s a complex procedure so it takes time to learn the surgical installation, and special attention to details is very much needed, and the bigger challenge in device management is to skillfully place these complex therapies in the management of patients – this can be termed as the judgment part.

 (60 votes, average: 4.73 out of 5)